- General
-
 Questions

+2
Answered
Where is the 24% profit coming from?
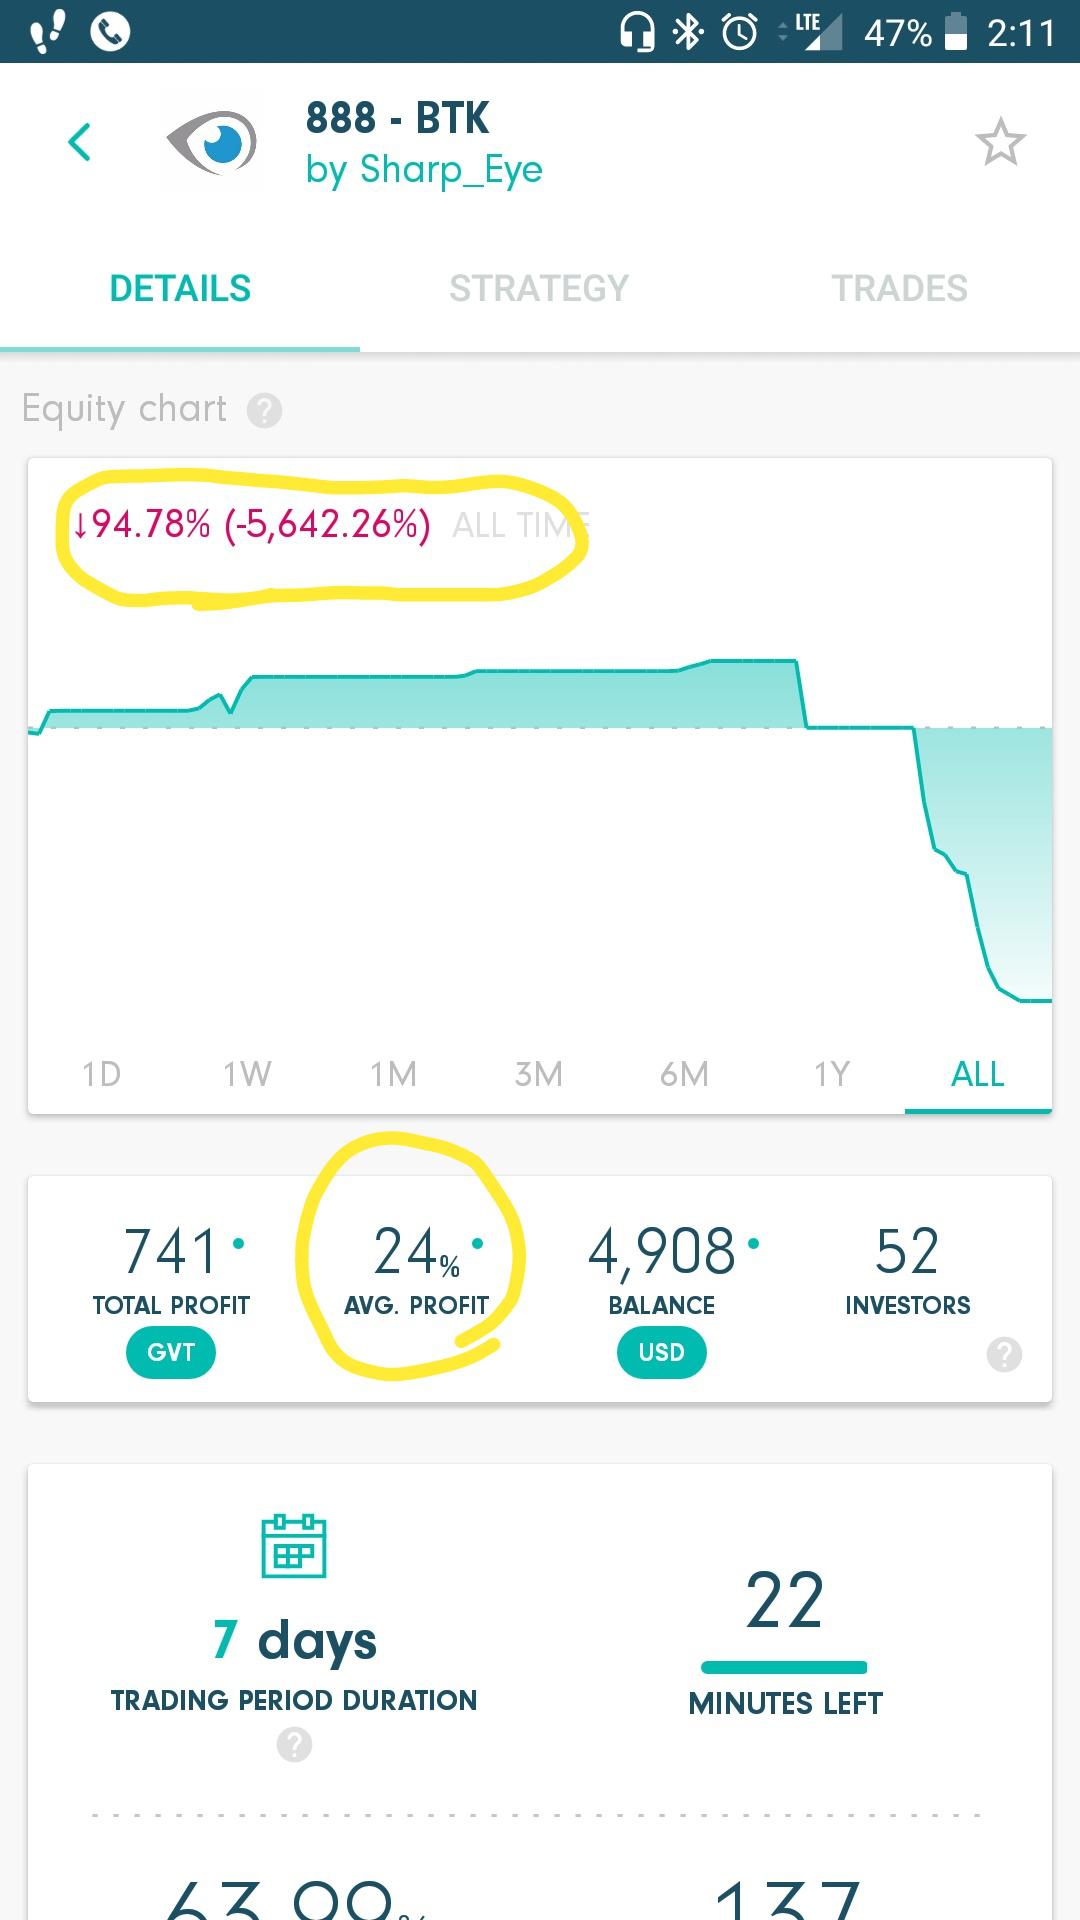
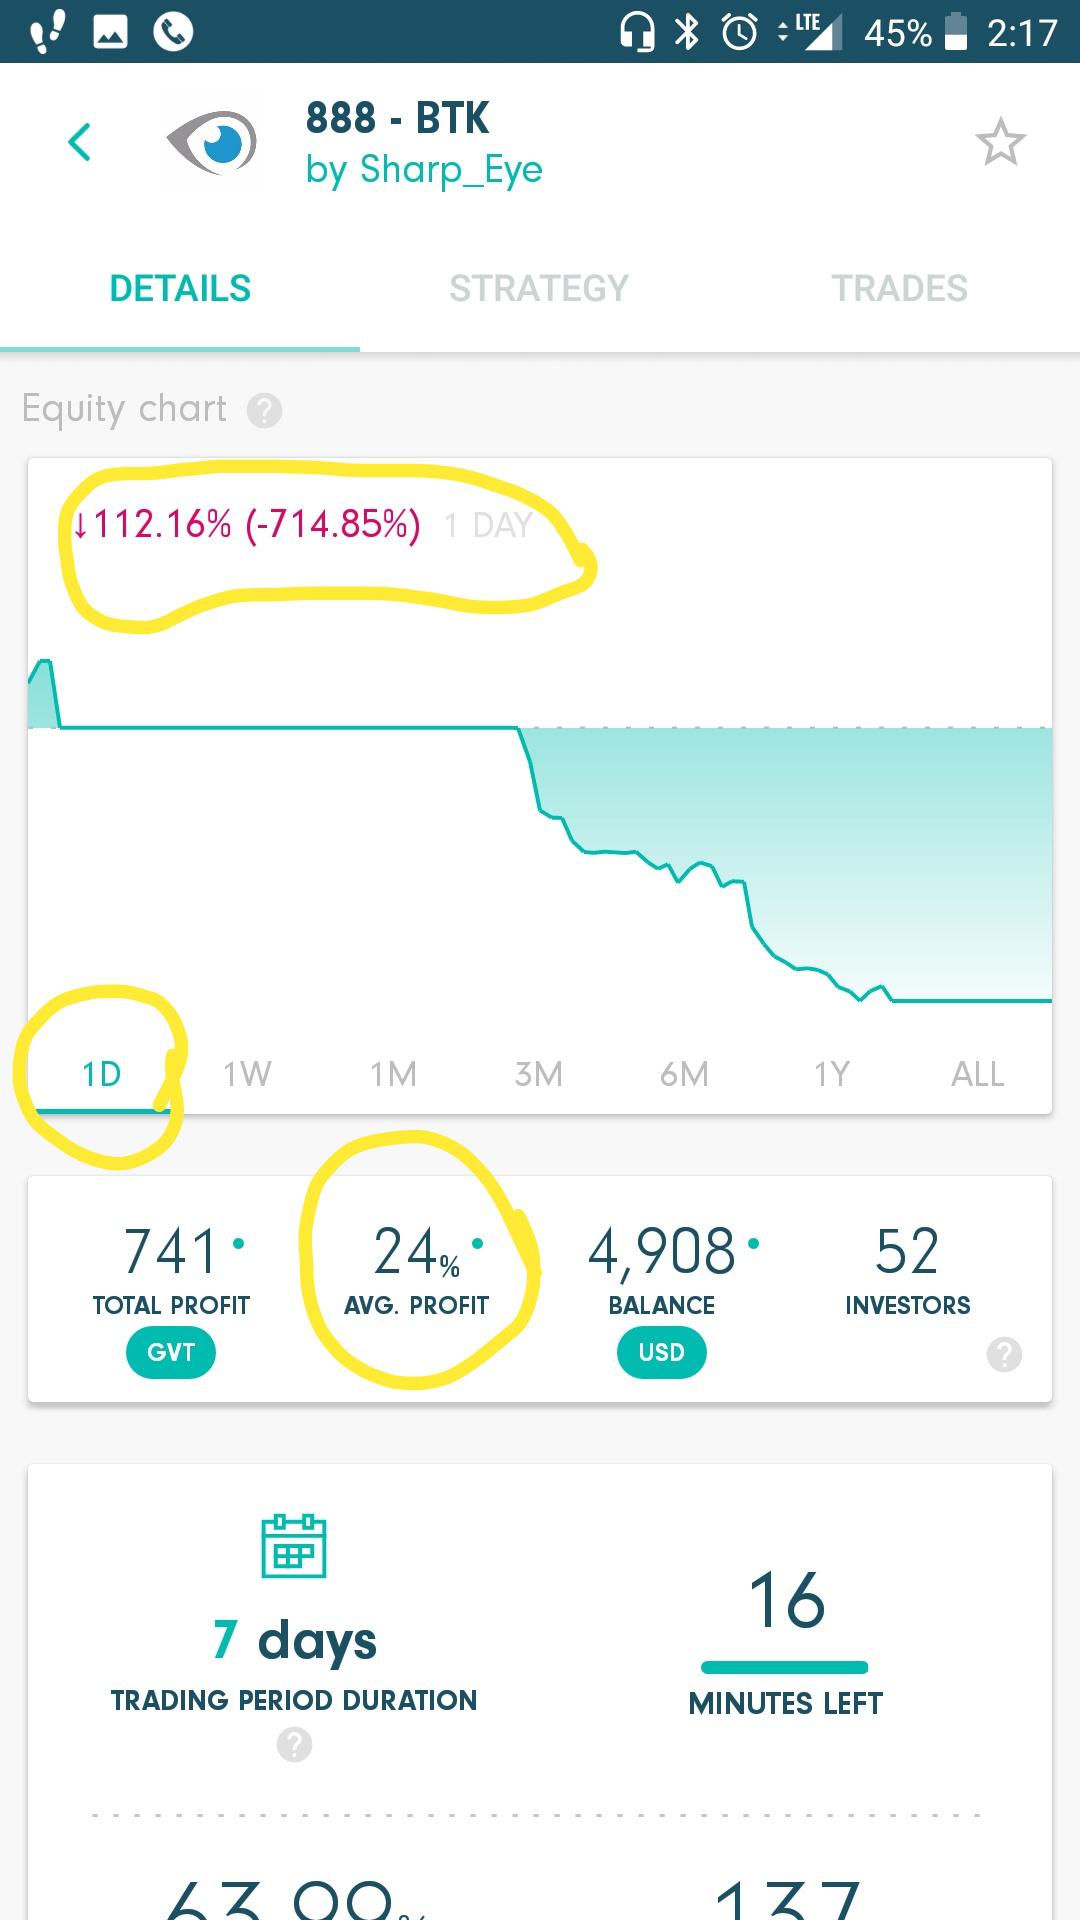
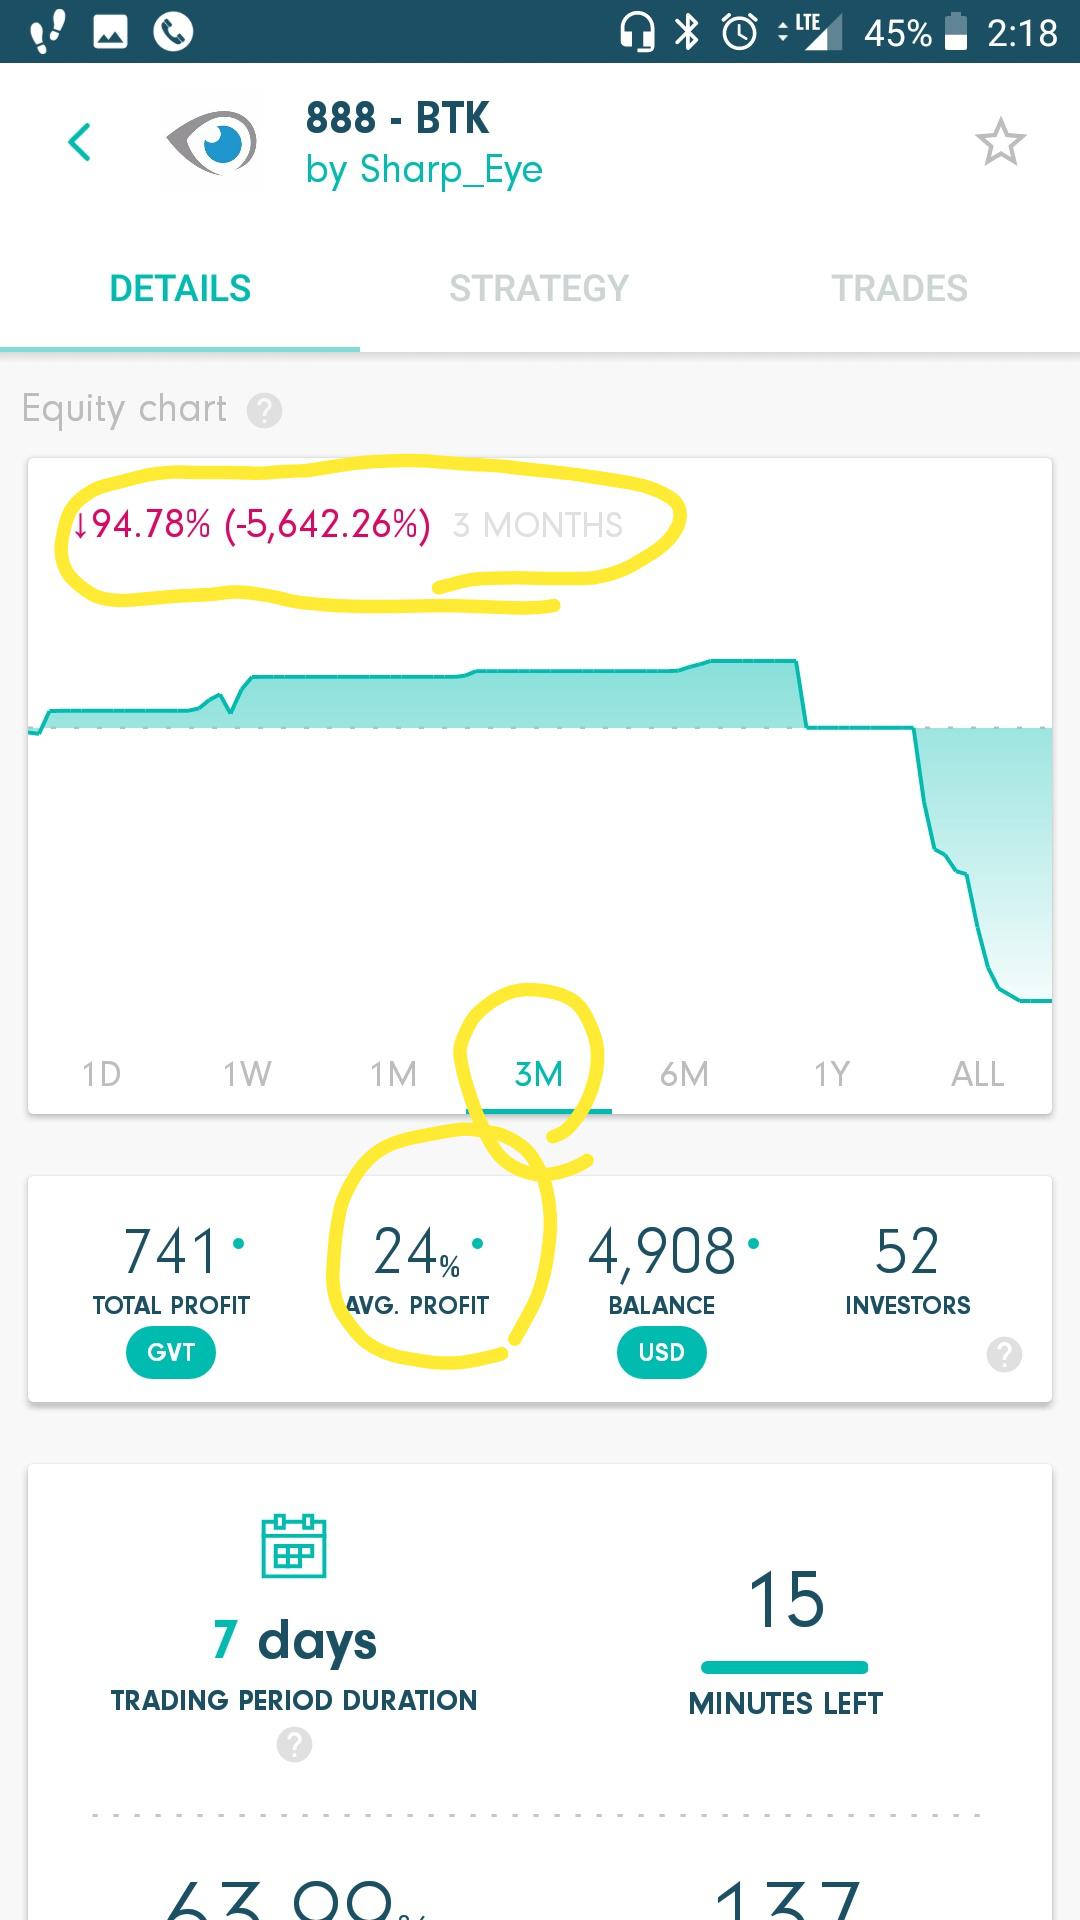
I fail to understand where this manager is getting the 24% Profit when the Historical data is showing NEGATIVE Profit.
Can you please look into this?
Customer support service by UserEcho

I checked a few other Manager History and I find the same issue. The Charts where it shows the % Profit for each period " 1 day, 1 week, 1 month and so on..." seem to have a bug.
Thanks for your question! It is because of you look at the equity chart and try to compare it with the profit. The profit is calculated as a sum of all the closed positions for all time. As for equity, it is manager's account balance plus the floating profit/loss of your open positions:
Equity = Balance + Floating Profit/Loss
When a manager has no open position, and so no floating profit/loss, then your account equity and balance are the same.
But, since GV platform's main idea I guess is all about how much Profit a Manager makes as a "%" for his specific trading period, I guess the Charts have to be made based on the PERCENTAGES but not by Equity. The whole information is geared towards the Percentages.. It will be Easy to understand for the community and for the Investor.
The Chart is RED but the % Profit is say 10% positive.. This will throw the investors into confusion. Eliminate the confusions for the Investors is really the most important thing.. or this can become a major concern down the road from the investors.
Please consider changing the Charts from Equity to Profit %. Profit % is what the investor is looking for before he invests.
Just my opinion as a trader for many years.